Lithuania Exports By Country
This page displays a table with Lithuania Exports By Country in U.S. dollars, according to the United Nations COMTRADE database on international trade.
2017
2016
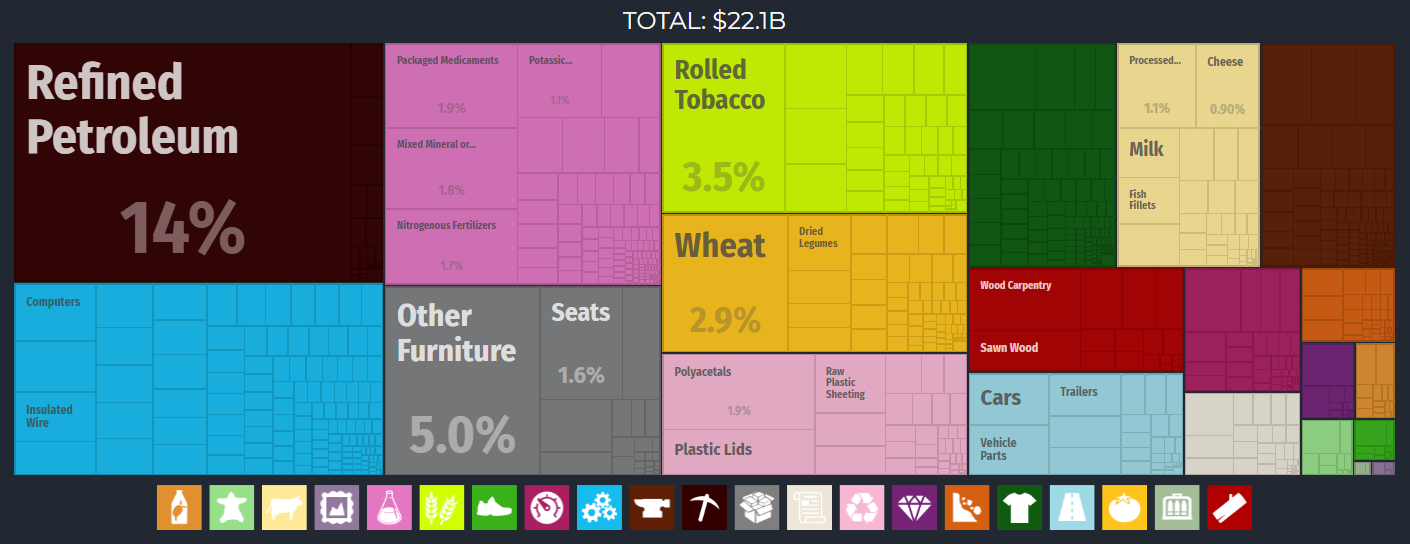
In 2016 Lithuania exported $22.1B, making it the 68th largest exporter in the world. During the last five years the exports of Lithuania have decreased at an annualized rate of -2.9%, from $25.9B in 2011 to $22.1B in 2016. The most recent exports are led by Refined Petroleumwhich represent 13.6% of the total exports of Lithuania, followed by Other Furniture, which account for 4.98%.
Lithuania Exports
2016
2016
Lithuania is the 68th largest export economy in the world. In 2016, Lithuania exported $22.1B and imported $26.7B, resulting in a negative trade balance of $4.6B. In 2016 the GDP of Lithuania was $42.8B and its GDP per capita was $29.9k.
The top exports of Lithuania are Refined Petroleum ($3.01B), Other Furniture ($1.1B), Rolled Tobacco ($777M), Wheat ($649M) and Polyacetals ($430M), using the 1992 revision of the HS (Harmonized System) classification. Its top imports are Crude Petroleum ($2.45B), Cars($953M), Refined Petroleum ($896M), Packaged Medicaments ($888M) and Tractors ($633M).
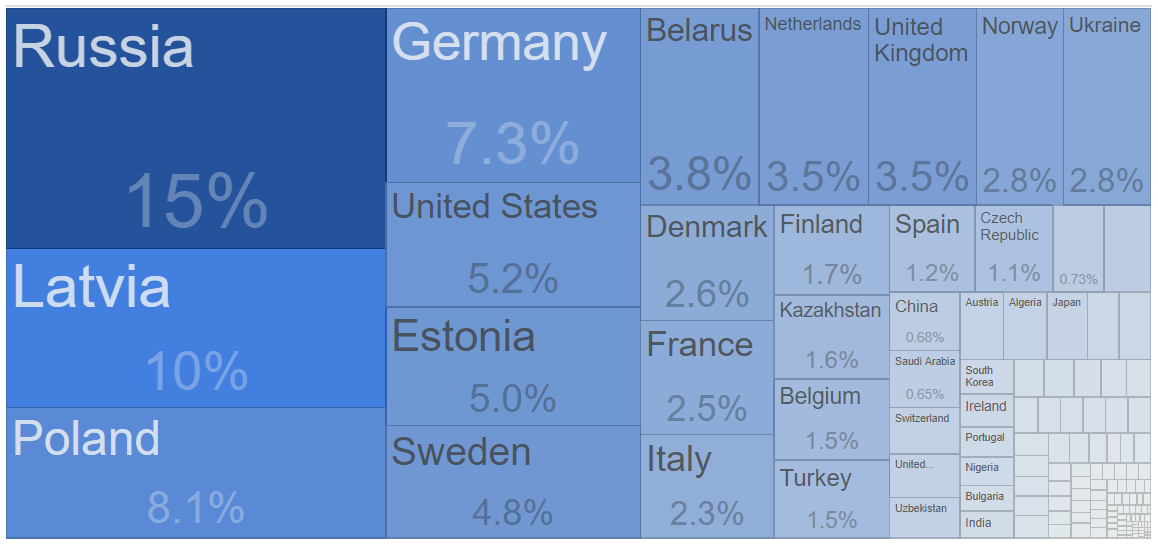
The top export destinations of Lithuania are Latvia ($2.14B), Russia ($2.06B), Germany($1.75B), Poland ($1.39B) and the United States($1.23B). The top import origins are Russia($3.59B), Germany ($3.32B), Poland ($2.74B), Latvia ($2.07B) and Italy ($1.4B).
Lithuania borders Belarus, Latvia, Poland and Russia by land and Sweden by sea.
2017
| Value | Year | |
|---|---|---|
| Russia | $4.47B | 2017 |
| Latvia | $2.97B | 2017 |
| Poland | $2.42B | 2017 |
| Germany | $2.19B | 2017 |
| United States | $1.55B | 2017 |
| Estonia | $1.48B | 2017 |
| Sweden | $1.43B | 2017 |
| Belarus | $1.14B | 2017 |
| Netherlands | $1.05B | 2017 |
| United Kingdom | $1.05B | 2017 |
| Norway | $846.61M | 2017 |
| Ukraine | $839.99M | 2017 |
| Denmark | $759.95M | 2017 |
| France | $747.45M | 2017 |
| Italy | $682.32M | 2017 |
| Finland | $508.77M | 2017 |
| Kazakhstan | $473.68M | 2017 |
| Belgium | $461.67M | 2017 |
| Turkey | $441.55M | 2017 |
| Spain | $362.59M | 2017 |
| Czech Republic | $336.45M | 2017 |
| Singapore | $216.00M | 2017 |
| Hungary | $203.88M | 2017 |
| China | $203.01M | 2017 |
| Saudi Arabia | $195.01M | 2017 |


